In the previous posts I’ve described how we sought to be faster and better. In the next two posts I’ll focus on our third key outcome — getting happier. This was very much a collaborative effort and I was extremely fortunate in being able to work with Roopa Singh, then HR Director at Moonpig, and Lawrence Hay, Group Head of Talent for the Photobox Group (to which Moonpig belongs).
In this first post I’ll focus on defining what we meant by being “happier” and how we planned to measure that. In the next post I’ll describe some of the actions we took to improve engagement.
What is happiness?
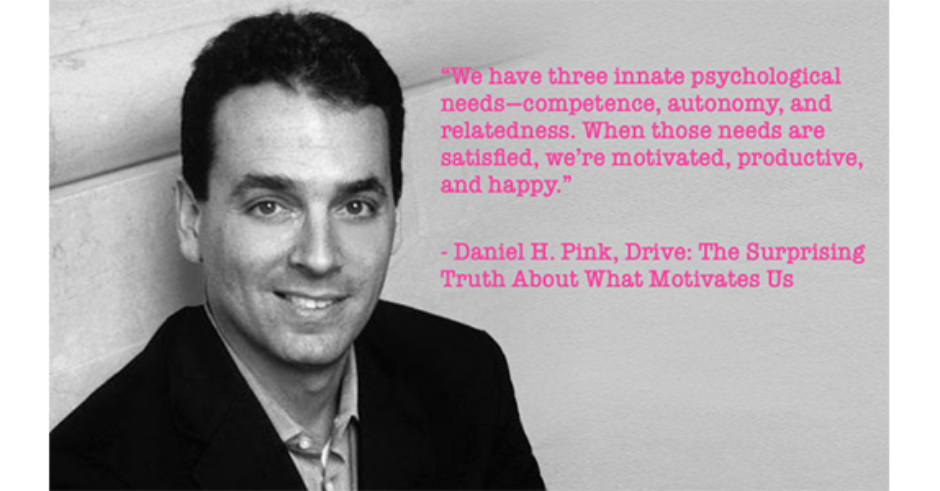
For us, being happier basically meant improving engagement. When it came to deciding how to improve engagement, Roopa, Lawrence and I shared the same vision. We were all very much inspired by the theories outlined in Dan Pink’s Drive, namely that beyond a certain point extrinsic rewards no longer serve to motivate people. Instead people are motivated by purpose, mastery and autonomy. Clear purpose lets people know what is expected of them. Autonomy empowers people to use their skills to achieve that purpose — it is the antidote to micromanagement. Mastery is having the necessary skills to achieve that purpose.
We believed that by giving our squads clear goals, the autonomy to achieve them and the means for everyone to keep learning we would increase staff engagement.
Measuring happiness
Engagement is a tricky area to measure, and to measure regularly. We had two methods. The first was the classic annual staff survey — an opportunity to gather very detailed information across the board. This always provided valuable insights, but an annual, or even 6 monthly survey, provides a very long feedback loop. We needed a way to capture actionable insights much more regularly.
“Appiness”
To that end Lawrence and I developed, “Appiness” — a Moonpig “happiness health check”. This was very much inspired by Spotify’s squad health check, but we modified the categories to be less software specific. The plan was to run happiness check-ups every couple of months in squad retrospectives. This would guarantee regularity and high levels of participation.
The health check focused on seven categories:


Each category, except Fun, also aligned to the three key areas of the Be THAT Manager leadership training programme which I’ll describe in the next post. Fun was an additional area we covered because it has always been an important element of Moonpig’s culture and something people in the organisation valued.
People were asked to rate each category; there were 4 levels of rating:

Each rating had a score:
Awesome (3 points)
Pretty Good (2 points)
Meh (1 point)
This sucks (0 points)
By obtaining a rating from each person for each category we were able to extrapolate a score and work out as a percentage how each squad rated the individual categories.
In addition to gathering this quantitative data, we were able to discuss low ranking categories with the squads there and then. This helped provide qualitative insights which helped us understand what was causing the problems which in turn helped identify actions to take.
You can download a copy of the categories and ratings cards here.
Scaling Appiness
To prove the concept, we ran a manual version of this with a few of the squads. We printed and laminated copies of the ratings cards and people would hold up the relevant card as they rated each category. I would then manually calculate scores and percentages for each category and translate that in to a graph. This was very time consuming, but as a proof of concept it was enough to demonstrate the value it could provide.
However, in order to regularly measure and generate useful data from these checks, we needed a digital solution. Tech resource being scarce, we used our annual hackathon to build a digital version. This would enable people to rate categories directly through a mobile device, and we could then automatically generate scores.
We also wanted to supplement the app with a dashboard to display the data so we could see the latest scores, but also see how scores changed over a period of time — were we getting happier or not?
In addition we wanted to build in the ability to view results by both squad and function meaning we could identify trends at different levels — squad X doesn’t feel they have autonomy, function Y ranks learning very low etc.

This is mock-up shows how we wanted to be able to view the results — the data is not real.
Acting on the data
Whilst the awesome hackathon team completed the the app during the hackathon, building the data dashboard proved too much to accomplish in 24 hours! There is still the aspiration to complete the dashboard, but it may take a while.
However, it’s worth outlining how I planned to make use of that data once we had the means to capture and display it. Ideally I would liked to have run a health check every two months to begin with — we could continue to review cadence. Once complete I wanted to go through the results with the leadership, talking through both the quantitative data and sharing the qualitative feedback.
The next step would be to work with the leadership to define clear actions to address the problems. Thereafter both the results and the actions would be shared with the entire organisation. Finally I wanted the leadership team to provide progress updates against those actions on a weekly basis — Moonpig holds a weekly all-hands which would provide an ideal time for this.
Translating real problems from anecdotal feedback in to hard data helps encourage leaders to take problems seriously. But for leaders, acknowledging the problems is not enough — they have to be seen to be acting on them.
If people are to trust and believe in their leaders, they need to see that there is real commitment to their engagement and well being.
What’s next?
By now you’ll hopefully have understood how we defined happiness and how we planned to measure it. In the next post I’ll describe some of the actions to improve happiness.